


How To Win the Election in 2008 (Fed Meeting Special)
Very little is certain in life, but we can say with absolute certainty that both the Republicans and Democrats want to win the November 2008 elections. We can also say with assurance that there will be winners and losers. Let's consider the scenarios which would lead to victory for each party.
Elections come down to one thing: the voters' pocketbooks. If the economy is doing fine and voters are employed and feeling wealthier, side-issues occupy center stage. But when the economy is tanking and voters are losing their jobs and feeling poorer with each passing day, then gay marriage and all the other "culture wars" issues which have served the Republicans so well over the past seven years will be quickly relegated to the same dusty bin as Nehru jackets and East Germany.
So what conditions are necessary for each party to win? What does each party have to engineer to insure a Nov. 2008 win?
1. the Republicans need the rotten-to-the-core, faltering economy to hold together until November 2008. The Democrats need it to tank by summer '08.
If gasoline prices and inflation have shot up--as they most certainly will as the Paulson/Bernanke Team destroys the U.S. dollar with endless rate cuts--then the Republicans will lose just as surely as the sun rises in the morning.
The Repubs can hope their current manipulation of data/bailing-wire-and-duct-tape act will work another year, but even the most loyal Elephant must be harboring some doubts that the "more of the same" lies about low inflation and the stupendous health of the credit markets can survive a year-long encounter with reality. If the Republicans gut the dollar, inflation will gut the economy and their chances of winning any election.
Here's what the Republican leaders should do if they have any hope that the economy will support their chances next year.
They should sit Hank Paulson (Treasury) and Ben Bernanke (the Federal Reserve) down and say, "Hank and Ben, you guys have done great jobs pulling the wool over the public's eyes about how fragile our economy really is, but we all know your dog-and-pony show can't last another year. If you send the dollar to sleep with the fishes, then oil will skyrocket and inflation will eat us alive."
Ben and Hank will shift nervously in their seats, because they thought they'd done exactly what their political masters had ordered: slather the B.S. on so thick that a few credulous nincompoops might actually believe them. "So Hank and Ben, don't cut the Fed rate. Yes, the stock market will take a hit, but better now than a year from now. For now, we have to do a Reagan and talk about the sacrifices which must be made to strengthen the dollar and kill inflation. You know, whatever Reagan said that worked."
"If we let the market tank now, then maybe by next summer it will be recovering, and we can declare victory over inflation. So you see, Ben and Hank, we really have no choice. If you keep killing the dollar, inflation will take away our chances of winning. Because you know what election banner everyone in the country will be watching? The price of gasoline at their local gas station. If it's high because you let the dollar fall in half and oil goes to $120 a barrel, voters will see $4 per gallon everywhere--and we are doomed."
2. Meanwhile, over at the Democratic High Council, the victory plan is considerably different. There the brilliant strategists are engineering the exact opposite future: one in which the economy plummets so hard by October that angry voters of every stripe will swallow whatever reservations they might have and vote Democratic.
Here's the linchpin of the Democratic plan: hammer the Republicans on their abject failure to protect consumers. Where were the regulators when the mortgage industry careened off into a risk-be-darned orgy? Where were they when investment bankers created exotic financial instruments and then arbitrarily set the values via "mark to model"? The Repubs have no defense; they are extremnely vulnerable because they did in fact completely fail to protect consumers. Their interests were one-sided: help enrich their wealthy pals on Wall Street.
But here's the truly brilliant part of the Democratic strategy: enact legislation that requires every financial instrument to be marked to market at the close of every trading day. That would be any financial instrument--stock, bond, mortgage-backed security, CDO, derivative, SIV, everything owned or traded by any firm based in or trading in the U.S.--virtually everything.
The moment this measure became law, a full financial meltdown would ensue. Amidst the carnage, the Democrats would hammer on the excesses, the lack of oversight, and the unceasing support of rich Wall Streeters which characterized all eight years of the Republican reign. There would be little for the Republicans to defend, for the meltdown itself would constitute proof that they'd abetted a fatal lack of responsible oversight.
Maybe the Fed will foolishly drive the stake deeper into the heart of the flailing dollar today with another rate cut. But maybe not. If they decline to prostitute the Federal Reserve to the capricious greed of Wall Street, we would do well to wonder if there is a deeper, far smarter strategy being played out "For the Money Next November."
Extra Special Fed Meeting Bonus Entry
Astute correspondent Roger sent in a news item which has largely escaped notice: NYSE Eliminates Trading Curbs Dating Back to 1987 (Bloomberg)
The New York Stock Exchange said it will no longer impose curbs on computer-program trading that were put in place after the crash of 1987, claiming they're no longer as effective in damping swings in prices.
The exchange will stop prohibiting brokerages from entering some program trades when the NYSE Composite Index rises or falls more than 2 percent, according to a notice sent to member firms today. The so-called collars had been in effect since 1988 and were triggered 17 times this year, according to a filing with the Securities and Exchange Commission.
Roger added these cogent comments:
Why would they do this after the experience of 1987? Or am I missing something? I don't like it one bit but I am not a trader and do not know how things work in the trading pits.
Are we being set up for a fall? If so, there are some 'short' ETF's out there that may fit the bill as I do not trade options.
Roger also recommended the excellent blog by Elaine Meinel Supkis, Money Matters.
And for your viewing pleasure, here is a chart of the VIX/volatility index. Is this the chart of a VIX which is set to decline as the market races up in Fed-rate-cut euphoria? Absolutely not. It's the chart of a VIX about to rise as the market falls.
As I write this Tuesday morning, both gold and oil have fallen from their recent peaks. Hmm. If the Fed is about to decimate the dollar with a big cut, why are gold and oil falling?
Let's say you and your pals knew the Fed would "disappoint the market" by not cutting rates, or not cutting enough to goose the market ever higher. What would you do?
1. You'd sell gold and oil which have risen on the expectation of the Fed giving Wall Street a big gooey load of rate-cut candy.
2. You'd go short with put options and short-selling into the rate-expectation rise.
3. You'd engineer the end of the trading curbs which might have limited the market's fall. Now it can fall more than 2%, hugely enriching you and your pals in a matter of hours or days. Recall that as the market plummets, short positions and puts rise in value.
Or am I making all this up? You be the judge. The VIX and the pulling of curbs that have been deployed 17 times this year alone certainly looks peculiar to me, but maybe it's nothing. Maybe the Fed will serve up a juicy half-point rate cut and the market will spasm reliably higher on the fabulous news that the U.S.A. has officially abandoned its currency to the junkyard dogs. Happy day. Or maybe not.
Thank you, Richard L., ($20) for your much-appreciated generous donation to this humble site. I am greatly honored by your support and readership. All contributors are listed below in acknowledgement of my gratitude.
Wednesday, October 31, 2007
Tuesday, October 30, 2007
Empire of Lies, Kingdom of Magical Thinking
We in the U.S. live in an Empire of Lies. Nowhere is this more painfully visible than in the real estate industry. The real estate/building industry inflated the bubble with an interconnected chain of lies, deceptions and deliberate statistical legerdemaine.
The American public willingly accepted a free pass to the Kingdom of Magical Thinking, where they could indulge their fantasies of gaining great wealth by doing nothing more than owning a house.
So what's different about this real estate bubble? The lying and deception are the systemic props holding up the entire rotten structure. Let's take a look at the dominoes of cascading lies:
Magical thinking was essential to the bubble's inflation. Want to get rich without doing anything? Buy a house or three, sit back for a few months and then sell them for a huge profit. Rinse and repeat. This was speculation, not investment. And of course the real estate industry supported this speculation because the churn of transactions--sales, new mortgages, and the packaging of mortgages into MBS and CDOs--creates the fees and the profits.
"Buy and hold" investing generates virtually no profits for the industry. Turnover and churn create the big profits, and magical thinking--of getting something for nothing--drove the speculative frenzy which generated all the fees and fat profits.
What happened to personal and business responsibility? Both are missing in action. No need to read the loan documents because we're going to flip this baby in a few months. No need to explain the loan re-sets; the buyers wil be out of this place long before the mortgage re-sets. Since housing only goes up, all these mortgages are low-risk. And so on.
The mainstream media and government regulators were complicit in accepting and not questioning the interconnected lies. "Asleep at the wheel" is being charitable when you consider the vast sums spent by the real estate industry for print and broadcast advertising. We as a nation have had to rely on the blogosphere to dig beneath the self-serving industry hype for the truth--a skepticism that was once the hallmark of solid journalism.
Welcome to the Kingdom of Magical Thinking. Here in the Empire of Lies, the Kingdom of Magical Thinking is only open for a limited time. Now that the gates have closed and the speculators, mortgage brokers and investment bankers have been pushed back out into the real world, we hear a deafening hue and cry that someone must be to blame for their losses.
Yes, someone is responsible: every speculator, appraiser, realtor, lender, investment banker, rating agency, regulator and media outlet which generated, accepted, and then passed off the lies as reality is responsible. Lies can only be sustained for so long, and the Empire is crumbling a bit more each day. Who's responsible? Collectively, we need only look in the mirror to find the culprits.
Is there anything you can do? Yes, there is. And it takes about one minute.Go to Citizens For Financial Responsibility Petition and fill in the few lines of the form. (Read the petition first of course. You will probably agree with all of it.)
The citizen who has spent time and money to create this worthy petition, Karl Denninger, reports that 31,000 people visit his blog every month and only 4% have signed the petition. Well, this blog also gets about 35,000 to 40,000 unique visitors a month. If every one of you took a single minute and signed the petition, that alone would create a heads-up in Congress.
(Non-U.S. readers, just use this address:
1601 Pennsylvania Avenue, Washington D.C. 20510
This is the address of the 24-hour-per-day vigil for peace, justice, and global nuclear disarmament in Lafayette Park across from the White House)
I know, because one of my cousins has been a high-placed congressional staffer for decades. If you want even more impact, type up a short personal letter describing your outrage at all the financial lies and lack of Federal agency oversight, and send it to your Senators and Representative.
One personal letter is literally worth a hundred form letters or a thousand signatures. But do whatever you can, and whatever is comfortable. Surprisingly, I often get a thoughtful letter back--sure it's a form letter, but some staffer actually read your letter. That in itself is a small victory.
U.S. Senate (look up your senators' addresses)
U.S. House of Representatives (look up your representative's address)
I promise signing the petition is quick and painless. You will feel better having done it.
Thank you, Bruce H., ($25) for your much-appreciated generous donation to this humble site. I am greatly honored by your support and readership. All contributors are listed below in acknowledgement of my gratitude.
Monday, October 29, 2007
Beware of Speculative "Sure Things"
You would be hard-pressed to find an analyst or pundit who isn't bullish on gold and oil and bearish on the U.S. dollar. The agreement is virtually universal: the dollar is doomed, and gold and oil are rocketing up with no end in sight.
My contrarian instincts suggest the universality of these views dooms them to be almost certainly wrong. The NASDAQ would never drop below 4,000 (2001 pundits), the Dow Jones Industrials were heading to 100,000 (2000 pundits) and oil would remain cheap for a decade (1999 pundits). In every case the "standard model" of the financial/ mainstream analysts was exactly opposite of what eventually transpired.
But rather than argue, let's look at some charts, courtesy of frequent contributor Harun I. Let's start with oil, which just hit a key Fibonacci level at $92/barrel:
There are three large charts today; please view them at www.oftwominds.com/blog.html .
Next, here is gold, which also sports some divergences which suggest the euphoric speculation might be getting a tad overdone:
The much-maligned dollar, meanwhile, has declined to a key Fibonacci level, suggesting it might rear up out of its torpor and maul the complacent dollar Bears:
We should recall here that oil derivatives and futures contracts far exceed physical oil. Which is just a polite way of saying that rampant speculation can power oil higher independent of actual inventories and supply/demand. The same is of course true of gold; speculation in gold-based instruments can be independent of physical demand for gold.
In times of euphoric bullishness, the "solid fundamentals" are always touted ad nauseum. Yet when the price plummets, the fundamentals remain more or less in place. Were the fundamentals of the petroleum business horrible on August 16 when oil dipped to $67/barrel? No. Are they now 37% better, a mere 10 weeks later, now that the price has risen $25 to $92/barrel? No.
Will the dollar be debased to 27? If Fed Chairman Bernanke drops interest rates back to 1%, perhaps it will. But in the meantime, we should be alert to the old nostrum that nothing goes up or down in a straight line. The buck has dropped in a nearly straight line, and gold and oil have skyrocketed in nearly uninterrupted moves up.
Call me contrarian (or worse), but the charts suggest to me that big reversals are coming due this week. Maybe they will be brief interruptions in a trend; nonetheless, being on the same side as 99.99% of all the pundits, analysts and experts usually buys a one-way ticket to stunning (and entirely unexpected) losses.
Thank you, Matt N., ($20) for your thoughtful and generous donation to this humble site. I am greatly honored by your support and readership. All contributors are listed below in acknowledgement of my gratitude.
Friday, October 26, 2007
Could Oil Prices Collapse?
With oil over $90/barrel and seemingly headed for $100/barrel, let's ask a contrarian question: Could Oil Prices Collapse?
Peak oil--the slow but unavoidable decline in global oil production--is a reality. Some very credible folks believe we have already experienced the upper plateau of global oil production, and it's all downhill from here.
Other equally credible folks believe the final descent is still a few years away. (I have posted numerous excellent links below to aid your own conclusions.)
When we drop over the cliff of Peak Oil depends not just on supply, but on demand. Commentators almost unanimously foresee growing global demand for oil as China, India and other less-developed nations hurry through a vast industrialization.
But what if they're all wrong, and demand falls even faster than supply? The world would yet again be awash in cheap oil. Can't happen, right? Don't bet the farm.
Let's start with a long-term chart courtesy of frequent contributor Harun I.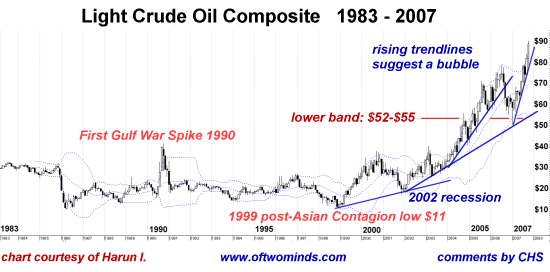
For an in-depth analysis of oil price fluctuations, I suggest Oil Price History and Analysis.
What are the obvious take-aways? Mideast crises spark price spikes, and global recessions knock prices down. In other words: let's say global oil supply drops 5% from 84 million barrels a day (MBD) to 80 MBD as a result of a Mideast crisis (is that a redundancy?). If demand is 84 MBD, then the price could spike up 50% or even 90%, as it did in 1990.
But what happens if a global recession drops demand by 5%? Then prices can fall in half or even more, as they did in 1999. Note that the Asian Contagion recession was limited in global terms; the world's largest economies, the U.S. and Europe, were growing robustly even as southeast Asian economies suffered currency and credit contractions.
Even this limited downturn caused oil to drop from over $35/barrel to under $15/barrel. That begs the question: what would happen to oil prices if the major global economies actually shrink rather than grow?
I know, I know, recessions have been officially banned by the Federal Reserve and the other central banks. Uh, right. But let's say the Fed can't stop the U.S. sliding into recession, and the rest of the world declines behind it.
Even if interest rates drop to 1%, if the consumer is under water and overleveraged already he/she can't borrow any more money. And risk-wary lenders will no longer be willing to give money to people who are mere months away from declaring bankruptcy.
Now who would benefit from a collapse in oil prices? Hmm. Let's say various agencies in the U.S. government and other governments accept that a global recession was now inevitable. I don't mean the worthless shills in the Fed and the Treasury Department--I mean the Real Players in the Pentagon, Intelligence community and Executive branch.
Let's say various goverments have an interest in either crippling or replacing the ruling regimes in Iran, Russia and Venezuela. What is the weapon of choice? A barrage of W-88 nuclear warheads? That would certainly kill many innocent people and destroy infrastructure, but these weapons wouldn't hit the intended targets: the political powers-that-be.
Let's connect the dots. The absolute best way to cripple or overthrow the regimes of these oil-dependent economies is to drop oil prices back to $20 or lower. Such a plunge would engineer the same death-spiral that nearly bankrupted oil-exporters in 1999.
As their primary (or only) revenues dry up like a puddle of water in the desert, these regimes--totally dependent on oil revenues for their lavish social spending and subsidies--have no choice but to pump even more oil to offset their staggering losses of income. This exacerbates the oversupply and the continuing drop in global oil prices.
Can't happen? Recall that prices are set on the margin. History shows again and again that a 5% decline in oil supply does not result in a 5% decline in price; a 5% increase or decrease can eventually lead to price swings of 50% or more.
Who else would like to see Iran removed as a regional challenger? Saudi Arabia has spent much treasure and effort to become the central player in the Mideast. Its citizenry are mostly Sunni. Iran is Shi'ite. Which nation is vulnerable to a collapse in oil prices? The Saudis would certainly have to cut spending as revenues declined; perhaps they might even have to tap their immense reserves of capital for a few years.
But Iran is already teetering on insolvency, even with oil prices as record highs. Both Venezuela and Iran subsidize their citizen's gasoline to absurd degrees, and as a result (of course) gasoline is squandered. As a result, the Iranian authorities imposed quotas for gasoline purchases, causing widespread unrest and even rioting.
How will they manage if oil falls to $20 a barrel again? How angry will the mobs be when bread, gasoline and other staples are no longer subsidized because their government is flat broke? Russia too is riding high atthe moment based almost solely on ballooning oila nd gas revenues. Were those revenues to fall by 2/3, what would be the consequences?
Suppose that, without much fanfare, the Saudis continued pumping huge quantities of oil into global supplies, further depressing prices, even as OPEC officially calls for reduced production.
Recall that the U.S. alone consumes 25% of global oil. A deep, prolonged recession in the U.S. is enough in and of itself to drop global demand by more than enough to trigger a price decline. And as the fast-growing economies of China and Asia slow down behind the U.S., then demand falls further. As the dominoes fall, global demand weakens until a price collapse occurs.
Yes, we will face Peak Oil at some point. But if global recession cuts demand by 10-20%, then oversupply will quickly rear up and the consequences to oil-revenue-dependent states will not be positive or brief.
Readers sent in a number of excellent links on Peak Oil and other petroleum-related stories:
From Fabius Maximus:
The Shape of Oil to Come (theoildrum.com)
Peak Oil (Federal Reserve Bank of Cleveland)
From U. Doran:
Peak Oil (www.energybulletin.net)
Oil Bull Market Analysis (www.gold-eagle.com)
Oil Market Analysis by Dorsch (www.financialsense.com)
Oil Market Analysis by Simmons (www.simmonsco-intl.com)
Oil Business Update (www.weedenco.com)
Global Oil Update (www.theoildrum.com)
Russian Natural Gas Treatise (www.321energy.com)
From Cheryl A.:
presentation by Kenneth Deffeyes (video of the author)
Energy Watch Group (Germany) (video)
Thank you, readers, for the excellent recommendations.
Thank you, John U., ($44.44) for your generous and numerologically-attuned-to-the-economy donation to this humble site. I am greatly honored by your support and readership. All contributors are listed below in acknowledgement of my gratitude.
Thursday, October 25, 2007
Is a Weak Dollar Really That Wonderful for the Nation?
The Financial Media loves to crow that the weak dollar is boosting U.S. exports, trimming the trade deficit and helping the juggernaut U.S. economy keep growing. Nice, but what about the pesky facts?
Here is a typical happy-happy story by the reliable cheerleaders over at BusinessWeek:
Exports: The Economy's Secret Weapon
A narrowing trade gap will offset some of the housing-related weakness
Amidst all the bullishly lavish praise for exports contributions to GDP growth, BW let slip a few lines of reality:
Last year the gap, comprising the trade deficit and some other financial transactions, had risen to a record 6.2% of gross domestic product, from a mere 2.5% in 1998. Totaling $811.5 billion last year, the chasm between U.S. consumption and production required an equal amount of foreign capital to finance.
Heading into 2007, the greenback had fallen 18% against all currencies since its peak in early 2002, and since the beginning of this year it's down an additional 4.1%. Two factors that tend to increase the attractiveness of assets outside the U.S. argue for a further decline: Growth prospects abroad continue to look brighter than in the U.S., and the Fed appears set to reduce interest rates while other central banks are in a holding pattern.
The article goes on to claim that export growth will generate 175,000 new manufacturing jobs, but neglects to mention the U.S. workforce is about 133 million--all of whom will suffer from higher inflation, reduced purchasing power and higher borrowing costs as the dollar continues its decline.
Here is a chart I've prepared showing the see-saw of the dollar's decline. While a relative handful gain, 300 million suffer disastrous consequences:
please go to www.oftwominds.com/blog.html to view charts.
The Commerce Department issues monthly reports on exports and imports; here are some highlights from the May report:
In the month of March 2007 U.S. exports grew by 9.2 percent over March of last year to $126.2 billion, and imports increased 6.9 percent to $190.1 billion.
In the first quarter of 2007, U.S. exports of goods and services grew by 9.8 percent compared to the first quarter of 2006 to $377.0 billion, while imports increased 4.2 percent to $557.7 billion. The largest export markets for U.S. goods and services in the first quarter were Canada ($57.8 billion, up 2.9%), Mexico ($32.4 billion, down 0.9%), Japan ($15.5 billion, up 8.5%) and China ($14.5 billion, up 15.5%).
Note the statistical legerdemain: exports rose at a higher rate, suggesting whoopie-do, we're solving the trade imbalance, but since exports are only 65% of imports (on an annualized basis--see below), the actual export gain of 9.8% is only slightly larger than the 4.3% rise in imports.
Here is a chart of imports and exports since 2002, drawn from the Census Bureau's U.S. Trade in Goods and Services - Balance of Payments (BOP) Basis report:
| year | Balance | Exports | Imports |
| 2002 | -423,725 | 974,721 | 1,398,446 |
| 2003 | -496,915 | 1,017,757 | 1,514,672 |
| 2004 | -612,092 | 1,157,250 | 1,769,341 |
| 2005 | -714,371 | 1,283,070 | 1,997,441 |
| 2006 | -758,522 | 1,445,703 | 2,204,225 |
Here's a chart of the dollar. Note the 35% decline from 2002:
To be accurate, we need to adjust U.S. exports by this 35% decline in the dollar. Why? Let's say you sold 100 euros of U.S.-made goods in Europe in 2002. You exchange the 100 euros for dollars and get $90 for your exports.
Fast-forward to 2007. Your 100 euros of exports are now exchanged for $142. Wow! Our exports rose by $52! Great! But oops--the gain wasn't from more good sold--it was all forex (foreign exchange).
Granted, exports of actual goods and services have risen; and of course exporting companies hedge currencies to minimize the disruptions of currency fluctuations. All of this makes it difficult to measure these huge numbers accurately.
But still, if we multiply the $974 billion in 2002 U.S. exports by the 35% loss in the dollar's purchasing power, we get $1.3 trillion--which suggests a majority of the export gains reflected in this chart are not in actual goods shipped but in dollars depreciated by our "low interest rates are good" Fed and Treasury.
There's another fly in the ointment: inflation. A modest gain in exports helps a few select global corporations boost their dollar-denominated profits and a couple hundred thousand workers; but meanwhile, the inflation triggered by the weakening dollar drops the purchasing power of all 300 million Americans.
Bottom line: the weakening dollar is good for a few and bad for everyone. The Federal Reserves is destroying the purchasing power of 300 million by cutting interest rates to support its grateful buddies in the stock market and investment banking industries. The pitch, of course, is that "low interest rates help us all," but once you factor in inflation from rising oil and imports, that's not quite the unalloyed blessing the Fed claims.
Thank you, Sean H., ($50.00) for your very generous donation to this humble site. I am greatly honored by your support and readership. All contributors are listed below in acknowledgement of my gratitude. Read more...
Wednesday, October 24, 2007
This Week's Theme: Harsh Realities
Why Mortgage Rates Will Rise Despite Fed Rates Cuts
The Federal Reserve dropped its Fed Funds Rate a half a percentage point in September and launched a wave of euphoria which swept round the financial world.
For some mysterious reason, U.S. mortgage rates did not drop a half-point; they actually went up, making it even more expensive to borrow money. Gosh, couldn't those folks at the Fed foresee the negative consequences of their moves? I guess not.
Since no one in the Fed or the media seems to be wondering why mortgage rates rose despite the headlines announcing "Fed Cuts Interest rates!!", we'll take a shot at it.
In a financially rational world (yes, I know, hahaha), you would have to offer a premium--say, high interest rates--to compensate foreign institutions and investors for the risks they're accepting buying your debt and your currency (your debt/loans are denominated in your currency).
Yet foreigners have been purchasing stupendous amounts of U.S. debt (U.S. Treasuries and other loans, including mortgage-backed securities and all those lovely acronym "investments" such as CDOs and SIVs) despite the fact U.S. interest rates are low and owners of dollars have suffered a horrendous haircut since 2002. (see chart)
Please go to www.oftwominds.com/blog.html to view the charts.
Here is one of my favorite charts, which depicts how gargantuan Chinese buying of U.S. Treasuries coincided with the "conundrum" of super-low U.S. interest rates. Coincidence? Hardly:
Now we hear that foreign institutions have reversed course. Rather than buying more dollar-denominated debt, they're selling--and selling big: Foreign Investors Abandoning US Treasuries
Treasury Gain May Falter; Foreign Holders Flee Dollar (Bloomberg)
Treasury investors basking in the biggest rally in four years have reason to fear for their profits: The largest owners of U.S. government debt are heading for the exit.
And here's a Bloomberg report from just last week, Oct. 17:
Japan, China Sell Most U.S. Debt in at Least 5 Years
Japan, China and Taiwan sold U.S. Treasuries at the fastest pace in at least five years in August as losses linked to U.S. subprime mortgages sparked a slump in the dollar.
So what if foreigners are fleeing U.S. Treasuries and the dollar; the American public stands ready to buy their nation's debt--right?
Oops! The American public is straining under the crushing weight of unprecedented levels of household debt. Guess they won't be buying any Treasuries from non-U.S. central banks, will they?
The cheerleaders will be rushing to note that U.S.-based bond funds like PIMCO could save the day by buying more U.S. bonds. But before you get too euphoric please recall that PIMCO's assets under management are $668 billion--and to balance their risks, they hold non-U.S. bonds and a variety of corporate and municipal bonds.
Since foreign central banks own $2.2 trillion in Treasuries, and various Mideast institutions hold unrecognized billions in London and offshore banks, let's guess that all the domestic bond funds put together would have trouble absorbing all the new Treasuries which get auctioned off every three months and all the T-bills being dumped by foreign entities.
So what happens as foreign investors flee the dollar and dollar-denominated Treasuries, corporate paper and U.S. mortgage-backed securities? Long-term interest rates (and mortage rates) will rise, regardless of what knobs the Fed fiddles with.
Once you understand that the global market sets the long-term interest rates on Treasuries and mortgages, then you understand that the Fed could lower their little piffling Fed Funds Rate to 1%, and mortgages could actually rocket ever higher as buyers of long-term U.S. debt vanish. The only way to entice them back to a sinking dollar and economy is to offer them a higher interest rate--a much higher interest rate.
Take a close look at the bond chart above. It suggests interest rates will be rising for a long time to come--if history is any guide, fifteen years or so.
Thank you, Karen M., ($25.00) for your generous and much appreciated donation to this humble site. I am greatly honored by your support and readership. All contributors are listed below in acknowledgement of my gratitude.
Tuesday, October 23, 2007
This Week's Theme: Harsh Realities
Web of Deception and What Must Be Hidden
When someone deceives you, these questions come to mind:
What's their motivation?
Who are they trying to deceive, and why?
What are they hiding, and why?
Who benefits if the lie is accepted as truth?
What are the consequences of the truth being revealed?
You and I and everyone else is being lied to on a grand scale, so we should be asking these questions. Here is a chart of what's being hidden:
The short answer to the above questions is simple; everyone generating huge profits from the debt-based shell-game which is the global economy is desperate to hide the truth from everyone who isn't colluding on the ill-gotten gains.
Let's consider each player and their lies.
1. The Federal Government: the Fed, Treasury, agencies and elected officials. The government is a huge beneficiary of debt-fueled prosperity: tax revenues rise, giving politicians more free candy to spread around to grease the palms of their wealthy contributors and distract the voters with entitlements and other free-spending goodies.
The nightmare scenario for any politician is a shrinking budget. when some budget item has to be cut, then some donor or constituency will be screaming. Not only is this unpleasant, it might cost the politico the next election. much better to lie and keep the debt machine rolling onward and upward.
How does the government deceive us? Let's count the ways.
Employment/Unemployment: Job hunters vanish without a trace after six months, and ghost jobs are created in the hundreds of thousands by a bogus "birth/death" model.
Inflation: As even the mainstream media is now admitting, official inflation is grossly manipulated to appear half of the true rate (3% vs. 6%). This lowers payments to those costly entitlement retirees and maintains the illusion that interest rates can be kept low because inflation is so low.
GDP: The GDP number always comes in "hot" and is usually revised downward later, when nobody's looking.
Federal Deficit: The Federal deficit contains a huge deception: the Social Security surplus is spent to offset current spending, reducing the "official deficit" by hundreds of billions each and every year. In exchange for these trillions, the Government issues the Social Security fund an IOU. The IOU is now about $4 trillion.
If this fiscal legerdemain were outlawed, then the true Federal deficit would be double or triple the "official" deficit.
"A strong dollar is in the interests of the nation." Hahaha... is that why you've engineered a 33% decline in our buying power since 2002 (the dollar index dropped from 120 to 80 in that time and is currently 78.) I'd hate to see what would happen if a weak dollar were in our interests.
All these accounting tricks serve one purpose: to deceive the citizenry and the world into believing the U.S. economy is stronger than it actually is.
2. The government has opened the floodgates of money and loosened banking regulations to help all those poor investment bankers. Regulators who should have provided oversight of the lending, mortgage and derivative markets have been idling away their time, doing anything but their job. Who's benefitted? Their pals churning all the origination fees, that's who.
3. The banks sold hundreds of billions in "safe investments" to institutions, domestic and foreign alike. Only now are the true risks and illiquidity of these SIVs, MBS, CDOs, etc. being revealed in the grim light of day.
4. Our trading partners who export vast quantities of goods to the U.S. (and who run stupendous trade deficits with the U.S.) have bought trillions in U.S. debt to keep us afloat. Since Americans don't save anything, somebody has to give them a credit card to fund all that spending.
So what's hidden? How utterly dependent the U.S. is on foreign buyers of Treasuries and debt to keep U.S. interest rates low. That's another little wink-wink, of course; when the Fed slashed the Fed Funds rate a half-a percentage point, headlines blared "Fed Cuts Interest Rate." Meanwhile, back at the Long-Term Interest Rate Ranch, 30-year mortgage rates actually went higher after the Fed's cut. Huh? Yes, that's right--because the market sets the long-term interest rates, not the Fed. Not that you'll ever read much about that, though.
So the "debt junkies" in the U.S. get their "fix" of abundant, low-interest debt from the "pushers" who need the junkie to keep buying exports and oil.
5. Exporters weaken their own currencies to keep goods affordable to the U.S. debt junkies. No matter how low the U.S. dollar sinks, the Japanese Yen and the Chinese Yuan stay at about the same exchange rate. Curious, isn't it? The Euro rises, the Canadian dollar rises, the Swiss Franc rise, but the Yen drops and the Yuan nudges up a couple percent.
The Pushers are happy to keep the cost of their "product" affordable to the hapless debt junkie. Manipulating Forex (foreign exchange) rates and sopping up another trillion in U.S. debt--hey, it's all in a day's work to keep the exporting profits rolling in.
6. The biggest supplier of debt junkies--a.k.a. debt serfs--is the real estate industry. Debt serfs couldn't believe their good fortune: not only were their houses rising in value at a fast clip (a rise fueled by subprime mortgages and "no document" loans), but banks and mortgage brokers were happy to loan them stupendous sums of practically free money on their rising equity to buy more furniture, flat-screen TVs, additions, carpeting, and heck, a second or third "investment property" ( i.e. speculative leveraging to buy more real estate.)
Whoo-hee, it doesn't get any better than HELOC (home equity line of credit) Heaven. And the lenders were happy to keep it all going onward and upward--the origination fees and re-finance fees were in the billions.
As for financial trickery--the real estate industry is a master. Sales figures for new and existing house look great--and then the number of escrows that actually closed is released quietly much later--a much lower number. Listing are "refreshed" so potential buyers won't see the original asking price or how many months the house has been on the market. Buyers were told they could refinance their option-ARM loans into a fixed rate virtually any time they chose to; not true, but so what? The buyer signed and the origination fee was pocketed. Yeah for our team!
7. The key was the astounding creation of new money via lending. OK, you're a bank. You need a paltry 1% cash reserve. So bank $1 million in deposits and you can write $100 million in new loans tomorrow, created right out of thin air.
But what a bother to be limited to a mere 100-fold leverage. So sell that first $100 million to a European bank as an SIV (structured investment vehicle) which puts it off-balance sheet--then write another $100 million in new loans. Rinse and Repeat. Is there any wonder that banks are terrified of the merry-go-round being shut down?
8. All that free cash from newly enriched homeowners spread everywhere: into more real state, SUVs, vacations, and even into the stock market. And since the market never goes down, it's also "safe" to margin your account and buy 50% more stock than you could have with only cash (which was borrowed off your house).
And to maintain the illusion of growing profits, corporations cook their books a la Enron. The game is still being played; liabilities are shunted off the balance sheet, profits are goosed with phony pro-forma numbers and trickery, analysts' estimates are magically exceeded every quarter by a penny, and insiders rake off hundreds of millions in stock option profits while the gullible debt serfs plow their 401K and IRA contributions into the market at the very top, having foolishly believed the insiders' accounting.
9. Investment banks have written hundreds of trillions of stock market derivatives--for nice plump fees, of course. What's the risk? Why, the market is safer now with all these derivatives floating around out there marked to model/myth/back-of-this-envelope.
10. And through it all, the mainstream media--endlessly worried about its own profitability-- soaked up hundreds of millions in advertising revenues from every business benefitting from the debt bubble. Realtors, furniture sales, home improvement stores, you name it--even as ad income from classified employment ads disappeared, these stalwarts of the debt/housing bubble economy were happy to spend millions on print and broadcast ads.
Which explains why the media has been asleep at the wheel until things are so obvious even they can't ignore them any longer. The media discovered the housing bubble a mere 18 months after it broke, and it is now discovering that inflation--I'm shocked, just shocked-- does not reflect reality.
What happens to media revenue and profits when the recession takes down their advertisers? And that's why the media and everyone else has kept all the web of deception under wraps as long as possible--because once the wheels finally fall off, so do their immense profits.
Correspondent Zeus Y. submitted a link and a comment which reveals how the financial deception has been disseminated as propaganda; even as the numbed citizenry are brainwashed into how "prosperous" they are, reality intrudes:
"The Karl Roves think they can “create” reality by simply gulling people into believing that what is good for Wall Street is good for everyone, and then bemoan the liberal media for getting people to be “irrationally” pessimistic as they are having to make choices between bread and heat. Man, something here is screwed up and it isn’t the people who are suffering."
PAYCHECKS BEING STRETCHED TO THE BREAKING POINT.
What used to last four days might last half that long now. Pay the gas bill, but skip breakfast. Eat less for lunch so the kids can have a healthy dinner.
Across the nation, Americans are increasingly unable to stretch their dollars to the next payday as they juggle higher rent, food and energy bills. It's starting to affect middle-income working families as well as the poor, and has reached the point of affecting day-to-day calculations of merchants like Wal-Mart Stores Inc., 7-Eleven Inc. and Family Dollar Stores Inc.
Pantries that distribute food to the needy are reporting severe shortages and reduced government funding at the very time that they are seeing a surge of new people seeking their help.
While economists debate whether the country is headed for a recession, some say the financial stress is already the worst since the last downturn at the start of this decade.
From Family Dollar to Wal-Mart, merchants have adjusted their product mix and pricing accordingly. Sales data show a marked and more prolonged drop in spending in the days before shoppers get their paychecks.
Does that sound like "prosperity," "low inflation," a "growing economy," and "a strong dollar" to you? Frequent contributor Michael Goodfellow sent in this disturbing financial fact:
An article in yesterday's Financial Times said that, "Only $9.9 billion of home equity loan securitizations have come to market since July 1---A 95% DECLINE FROM THE $200.9 BILLION IN THE FIRST HALF OF THIS YEAR AND A ROUGHLY 92% DECREASE FROM THE SAME PERIOD LAST YEAR."
Funny, isn't it, how little notice that stunning contraction received in our media.
There is something you can do to stop the financial deception juggernaut. Astute readers Charley R. and Graham M. recommended the petition analyst Karl Denninger has started, Financial Petition. Karl's blog Market Ticker has been listed in my right sidebar for many moons, and Karl is one of my heroes for starting this campaign to end financial deception.
You can also write your congressperson a personal letter; their staff supposedly give more weight to private letters than petitions. You can find congressional addresses via a web search.
Thank you, Rudy B., ($20.00) for your generous and much appreciated donation to this humble site. I am greatly honored by your support and readership. All contributors are listed below in acknowledgement of my gratitude.
Monday, October 22, 2007
This Week's Theme: Harsh Realities
Housing Declines: Don't Forget About Inflation
The real estate industry's Standard Model can be summed up as: "real estate never declines." Alas, reality has rudely disrupted this model--not just currently, but in the recent past.
As people worry and wonder "where's the bottom?" it is instructive to look at the last decline in real estate values during the 1990-1997 period. (It isn't exactly ancient history, folks.)
And even though many sprawling markets in the U.S. have experienced declines of 20% to 40% from the November 2005 bubble top even as a few others (Manhattan and Montana) have edged higher, let's work with the averages rather than the extremes.
With this in mind, let's look at reality: both the reality of nominal and inflation-adjusted declines in 1990-1997, and also the current decline in value:
Let's start with history. The decline in housing 1990-97 should be placed in the context of the very mild recession 1990-91 and relatively moderate borrowing costs (30-year mortgages were in the neighborhood of 7.5%.) Yet even with a growing economy and benign borrowing costs, real estate declined for 7 years both in nominal and inflation-adjusted prices.
If you kept $100,000 stashed in cash under your floorboards from 1990 to 1997, your cash lost 23% of its buying power. (You can check this yourself by going to Bureau of Labor Statistics Consumer Price Index website.) We all know "official inflation" is grossly understated as a matter of policy, so this 23% decline in purchasing power is extremely conservative.
Here's another way to illustrate the loss of value experienced by homeowners 1990-97: how many loaves of bread did it take to buy a house? A close friend (and very smart guy) put it this way in a recent conversation, and this brilliantly captures the heart of the matter: "how many loaves of bread" is a visceral analogy for inflation-adjusted purchasing power. The price of a house as measured by loaves of bread rather than depreciating dollars captures the real value of the house rather than its deceptive nominal price.
Priced in loaves of bread, house prices fell 40% from 1990-97. That is a simple undeniable fact. You can look up all the statistics in a few minutes on the web. But naturally the vast real estate and lending industries don't publish inflation-adjusted charts because they reflect the damning truth: real estate experiences bone-crushing losses in actual (purchasing power/inflation-adjusted) value.
The "real estate never declines" mantra has already been destroyed by fact. Outside of corners of Montana and a few other outliers, housing values have dropped in nominal terms virtually everywhere. To keep things simple, let's use the average of a 7% decline since the November 2005 top.
(NOTE: there are numerous opportunities for fun-with-statistics here. Shouldn't declines be weighted like stocks in the Dow Jones Industrial Average? In other words, shouldn't the 20% declines in vast swaths of high-priced, 36-million-residents California be weighted more than modest declines in smaller markets? Should houses above $1 million be excluded as they distort the average and median prices? I would say yes to both. In other words: median and average prices and declines are easily and routinely manipulated.
The most egregious is "median prices." A handful of $5 million homes selling will increase the area's median price even as 90% of the houses decline in value. Does this statistic reflect reality? Of course it doesn't--but it sure looks better to the industry.)
But even if housing prices stayed nailed in place (at $500,000 in the above chart), modest inflation slowly but surely eats away a third of the property's real value. Currently inflation is officially running 3-4% (please ignore the phony 2% "core inflation" hyped by the Fed's spinweisters); more realistic/less manipulated calculations conclude actual inflation more on the order of 6-7%. (Please read Shadow Government Statistics:)
Gimmicked Data Appear Aimed at Reducing Pressures on Fed for Another Easing / September M3 Annual Growth Hit 14.7% / Watch Out for CPI Annual Inflation Surge!
In other words: priced in loaves of bread, house values might actually decline 50% even as their nominal value appears to be stable. That is the painful effect of inflation: eroding purchasing power and eroding assets.
Housing is already declining in nominal terms. At this late date, even the shills and hypsters concede this undeniable reality. So let's assemble the most reasonable, fact-based assumptions:
1. housing declined in nominal terms 1990-1997. You can look it up.
2. housing has already declined 7% or so from its bubble top 11/05. In some places, the bubble top was mid-2006; regardless of the quibbles, nominal prices are declining virtually everywhere except in limited outliers where values are generally distorted by the sales of extremely pricey homes.
3. Even with the absurdly underestimated "official inflation" numbers, housing has taken a 6% hit since Nov. 2005. Did your house deposit 4% interest on its $500,000 purported value into your bank account like $500,000 in Treasury bonds did ($20,000)? No? Then it lost value, didn't it? Price it in loaves of bread and you get the same result.
If we extend these modest declines in both nominal and inflation-adjusted values to the same seven-year stretch of the last decline, we end up with staggering losses in real value.
Given that this bubble reached extremes far beyond the rise in housing 1983-1989--extremes in valuation, extremes in lending, extremes in interest rates and extremes in speculative frenzy--common sense suggests any declines would be even longer and deeper than those experienced in 1990-97.
Not only that, but consider the future effects of the credit contraction and the destruction of a trillion dollars in lending power. That is, no one will be writing any more CDOs, MBS or SIVs for years to come. All that easy money is gone, gone, gone and won't be coming back.
Also note that inventories are at record levels, with millions more units (new homes, foreclosed houses and all those speculative units "purchased to flip") in the pipeline. Overbuilding also reached an extreme.
And interest rates? Even as the Fed cut its rate by a half-point, mortgage rates actually rose. Recall that the Fed doesn't set mortgage or T-Bill rates--the market does. The Fed rate can drop to 1% again and if nobody's buying bogus risky debt any longer, then 30-year mortgages could be 9%. Don't believe it? It's already happening. Long-term rates are rising even as the Fed flails and churns, dropping its Fed Fund Rate.
In other words, there is every reason to expect the current downtrend to be longer and deeper than the 1990s decline. Extending the heretofore modest declines out five more years is thus extremely conservative.
Even with these conservative estimates, the actual value of a $500,000 house (January 2006) will decline to $300,000 by 2013.
Some will argue: but the bottom is almost here now. That begs the question: why wouldn't the real estate cycle repeat the historic pattern of "X years up is followed by X years down"? With so many extremes all blowing up at once--extremes of inventory, mortgage debt, total indebtedness, interest rates, lax lending, derivatives marked to myth/fantasy/model, and so on-- what conditions exist in reality that support a "the bottom is now" claim? None.
In conclusion: the above chart reflects a "best-case scenario." The worst-case scenario I leave to your imagination, for we are truly in uncharted waters.
Thank you, Susannah W., ($20.00) for your generous and much appreciated donation to this humble site. I am greatly honored by your support and readership. All contributors are listed below in acknowledgement of my gratitude.
Saturday, October 20, 2007
The Yen Revisited
Knowing my skills as a chartist are weak at best, I asked frequent contributor Harun I. to check my recent (Oct. 15) comments on the yen carry trade. Alas, I had the yen's movements exactly backwards. Here is the correct interpretation.
Please go to www.oftwominds.com/blog.html to view the charts.
Yes, I am an idiot, but it turns out there are two ways of charting the yen: a currency chart and a Forex chart, and I confused the two. Each is a mirror image of the other.
Now that we have that straightened out, we can see the Yen strengthened July - September, as we would expect as the dollar lost value. But then starting about October 1, the Yen started weakening along with the dollar.
In my view, this suggests central bank intervention to weaken the yen back to the 117 level, regardless of how low the dollar fell. Recently--just the last few days--this attempt to weaken the Yen in tandem with the dollar appears to have failed, as the yen has now risen back to the Carry Trade's profitability "line in the sand" around 115.
Why should you care what the Yen does? because if I'm right, then next week will be a blood-bath in the U.S. and global stock markets. The U.S. markets have roared up the past 7 weeks, invigorated by the Yen Carry Trade which got a new lease on life as the Yen weakened to 118.
But in the past two days it has reversed direction and started strengthening again to 115. Below 115, the carry trade is no longer a low-risk bet. As dollars leave the U.S. markets to be repatriated into Yen, the U.S. markets plummet. Of course there are many other knives embedded in the back of the U.S. Market Monster--renewed credit contraction, risk aversion, insanely overvalued tech stocks, weakening corporate profits, rising energy prices, rising inflation and a collapsing housing market, just to name a few.
On Monday (Oct. 15) I was seeking some correlations between the Yen and the Dollar and the U.S. stock market. I asked Harun for help, and he sent these charts. (The comments on the charts are mine.) Here is the Yen and Dollar:
And the Yen and the Dow Jones Industrial Average (DJIA):
Clearly, there is no one correlation which remains constant. Are there some correlations in certain time frames? It pays to be careful before reaching hard-and-fast conclusions. Here are Harun's comments:
"One thing that must be cautioned against is making conclusions from too little data. To investigate the media pundits claim of what is happening to the yen vs. the market (Dow Jones Industrial) we begin by visual inspection of a longer-term chart.
A cursory visual inspection of the Dow (red) and Yen (black) shows that from 1985-1995 the Yen and the Dow were in a bull market. It is worth noting that during this period and beyond, the Nikkei was in secular bear market. In 1995 the Yen peaked and then descended rapidly, bottoming in 1998. During this time the Dow remained in a bull market and the Nikkei was still in a secular bear trend.
Off the 1998 bottom the Yen rallied coincident with the Dow until 2000. At this time both peaked and began to decline however there are times when they were notably out of phase by 180 degrees (mid-2001 and early 2002). Both rallied again in 2003 into early 2005. Since then the Dow has rallied and the Yen has declined. (my emphasis added--CHS)
Even with this cursory analysis we can see that movement of the Yen at times is coincidental but not correlated to the US market. If one looks at the Yen price line one can see that it has been tracing out an ever-decreasing range of trading for the duration of this weekly chart. This formation means something and must be watched because breakouts of tight price formations at the primary and intermediate levels (long-term) usually lead to sustained long-term trends.
As for the Yen/Dollar relationship it must be understood that the Dollar has no futures contract. The USD Index is a geometrically weighted index of six currencies, with the Euro and the Yen having the greatest weight. Because of this weighting the Yen can and does move coincident with the USD. Most of the time the movement of the Yen is opposite USD and correlated.
A rising Yen line (black) indicates strengthening against the USD and vise versa. A rising USD (blue line) indicates a general strengthening against the indexes component currencies. With that said it should be noted that currencies carrying the least weight (Canadian Dollar, Swedish Krona) might have spectacular runs that have little affect on the USD Index.
The peak and troughs of the USD and Yen in 1995, 1998, 2000, and 2005 show opposite but not equal ends of the spectrum. Second quarter 2006 a decline in both can be seen. How does this happen? The other currency components of the USD Index, i.e., the British Pound, Canadian dollar, the Euro and Swiss franc have been acting rather bullishly. The decline of the Yen is the only thing standing in the way of a more pronounced decline of the USD. Carry trade or no, if all component currencies start rising the USD will decline.
A word about the carry trade: Much ado about something that is old hat. It is not the job of traders and investors to set economic policy. It is their job to take action to earn returns that increase or maintain purchasing power. Carry trades do not distort the market. The distortions seen today are the result of flawed economic policy. Investors and traders must exploit the foolishness of flawed government policy or be victimized by it.
Does the Japanese Central Bank intervene to protect Japan's economy? Of course, with the world's second largest economy being export based and most everything dollar denominated, they can and will intervene to keep their exports attractive.
Is it advisable in the long-term? Probably not; empirically, over the long-term such manipulations if not backed up by sound fundamentals lead to market corrections that become uncontrollable by any one entity. Power laws suggest that the less frequent an occurrence the more significant it is but that is another topic.
From an anecdotal perspective we can conclude that media pundits are falling prey to what is known as recency bias (weighing recent data more than earlier data) and belief in small numbers (drawing unjustified conclusions from too little data). The proper way to research this would be to run a correlation study.
This too, however, can be subjective. Do you do it on a one to one basis, which may not reveal trends well, or over an average time period? If we do it over an average period we would have to determine the length of the average that produced acceptable statistical relevance.
The media want us to believe in easy answers but there are none to be found."
Thank you, Harun, for your enlightening commentary. Even as I try to absorb Harun's analysis, I note the Yen has broken 115 as I write this Friday-- a line which I have noted (anecdotally, and yes, recently) seems to correlate with the U.S. stock markets dropping like proverbial stones.
If this is truly correlated, next week could be a real blood-bath in the U.S. (and global) stock markets.
I also asked Harun to comment on the Yen and Dollar's correlation to exports, i.e. Japanese exporting companies like Honda and Sony selling goods in the U.S. for dollars and then selling those dollars for yen. Harun made these observations about currencies, risks and hedges.
"Each exporter can decide how it will accept payment. If I want to be paid in yen the purchaser of my goods must sell their currency and buy yen. If I want to be paid in dollars then the importer has to come up with them and the exporter must convert those dollars into yen. Each has risks. For simplicity the exporter must protect against a decline in its domestic currency and an importer must protect against the strengthening of the foreign currency.
With that said, the BOJ doesn't want the yen to become too expensive or it will hurt the overall economy and even though it is frowned upon the BOJ does intervene to control the yen. This is short-term and at times as seen on the chart it fails.
Back to the risks.
If the Japanese exporter wants yen for his goods the risk is that the yen will weaken and therefore the exporter should short yen as a hedge. When we look at the COT data we see that Large traders are increasing net short positions and therefore Commercials are slightly net long suggesting that they are hedging against a rise or strengthening of the yen and simultaneously accumulating yen at lower prices.
Regardless of the complexity of these interactions we know that when these positions are lifted price will react. It is here we can use technical tools to gauge where support and resistance reside and place our bets.
To complete the circle, Banks and investors are looking to make money on interest. If you have a credit card with a 0% teaser rate it makes sense to use that card to purchase that plasma screen television than a 13% bank loan. So in that vein the carry trade makes perfect sense. It is simply good business to make money off the spread in the yield.
The market doesn't open the spigot, the Central Banks do. Their price control of money is what causes distortions. Leave the spigot open too long and a flood occurs. Leave it shut too long and there is a drought. Both are extremes and both are undesirable to the stability of an economy. As we have seen the market will turn off the spigot of liquidity when its interests are threatened.
Economic theory is both right and wrong. Price controls don't work, this is empirically proven. Human beings are not rational actors, this also is empirically proven. The economic tools the Fed uses (at least the ones released to the public) to gauge the economy have been hijacked and are no longer economic but political tools use to hold onto power. Of course this involves the requisite lying, cheating and stealing.
I would say that greater economic literacy would help but no amount of education will overcome greed. What is needed is a sense of responsibility to the generations that will follow but once again that also takes a back seat to profits.
The situation has become Darwinian, we either adapt (learn how to play the game and live ( maintain our standard of living and pass something on to the next generation) or we fail to adapt and perish (live in poverty). "
Thank you, Harun, for illuminating some of the dark corners of the currency /carry trade, and for addressing market correlations.
Thank you, Amit K., ($10.00) for your generous donation to this humble site. I am greatly honored by your support and readership. All contributors are listed below in acknowledgement of my gratitude.
Friday, October 19, 2007
"I'll Just Rent It Out"--Don't Be Too Sure
As someone who has managed rental housing part-time for 23 years, when I hear the owner of an "investment" house or apartment cavalierly say, "I'll just rent it out," my blood runs cold.
Why? It isn't that easy, folks. There seems to be a common misconception about renting out a housing or apartment as a landlord: the renter shows up, you sign the lease, and they send you money every month.
Prospective landlords, please note: a rental property "investment" is not a mutual fund. A mutual fund does not call you at 10 p.m. to notify you that the toilet is stopped up, or to tell you they've locked themselves out of the house, or to complain about their noisy neighbor. Mutual funds don't have roof leaks, nor do they sue you when they fall off a ladder.
The rental housing business is a people business, and you will be dealing with all the foibles, neuroses, grumpiness, self-interest and demands of actual real live human beings. Flipping properties is easy, having tenants is not.
Here is the bible of landlording which I highly recommend: Landlording: A Handymanual for Scrupulous Landlords and Landladies Who Do It Themselves It is a thick book filled with everything you need to know to become a successful landlord/ landlady.
Let me tell you how to do it if you want to regret becoming a landlord, not just today, but every day, and for the rest of your life:
1. Don't bother getting a credit report. Hey, he/she looks trustworthy--go with your gut on this one.
2. Make a decision based on ethnicity, gender, age, or whether they have children. And don't bother with a rental application, either.
3. Just use a one-page lease form you bought in the stationary store. Hey, keep it simple, right?
4. Write the lease so the tenant has to take care of the yard. It's their residence; they should mow the lawn.
5. Take a small security deposit because they're a little short of cash right now. Gee, they seem so nice; I think they're honest but just in a tough spot.
6. Don't take photos of the house/apartment before they move in or go through the hassle of a walk-through and document the inspection. Who has time for all these formalities. They signed the lease, that's all we need.
7. If you own a triplex, hire one of the tenants to be the informal manager. Who needs all the expense and paperwork of getting workers compensation insurance? It's just moving the trash cans and collecting rent checks, for goodness sakes.
OK, so here's the reality.
1. People may have legitimate stories of fiscal woe but if they have lousy credit (past due payments, etc.) then you're taking a huge risk that the next unpaid bill will be the rent.
2. It is illegal to select a tenant based on ethnicity, religion, gender, age or if they have children. Even if you're sure you're not biased, bias might be perceived if you don't keep scrupulous records and establish quantifiable metrics for selecting your tenants which you can provide as defense should you be hauled into court.
3. The lease is all you have to provide guidelines/conditions and verify the tenant agrees to all conditions, including how disputes will be handled. A simple lease offers no guidelines and as a result, every detail and conflict has to be negotiated as it arises, a situation which raises the likelihood of contentious disagreements and impasses.
4. The prospective tenant gushed that they loved to garden and would keep the yard beautifully maintained (and plant more flowers, too)--but alas, their back hurts now, or you didn't provide the right tools, etc. "But it's in the lease." Fine, but how are you going to enforce it? It's much easier to have all the service work performed by vendors and pay it out of the rent.
5. The security deposit is all you have to cover damage and the lost rent when tenants leave before the lease period is up. It's nice of you to let them move in with a small security deposit, but it's also bad business because you have no leverage. Remember, the lease is essentially worthless as leverage to get money out of a tenant unless you go to court--and you know how much that costs. Plus, if the tenant is now unemployed, "you can't get blood out of a turnip."
6. If the tenant trashes your house/apartment, what proof do you have that it wasn't in that condition when he/she moved in?
7. True story. "Informal manager's" mother climbs a ladder to change a light bulb and falls. "Manager's" attorney notes that there is no workers compensation policy in place to cover the manager. It takes $10,000 to make the problem go away.
This is just a small sampling of the realities of becoming a landlord/landlady. It doesn't really matter if you're renting one property or 10 properties, the care, documentation, customer service and maintenance requirements remain the same.
Keep these two points in mind: rental housing is a people business, and it's a "brick-and-mortar" business in which the bricks and mortar are continually in need of costly upkeep and maintenance.
Thank you, David C., ($100.00) for your very generous and most unexpected donation to this humble site. I am greatly honored by your support and readership. All contributors are listed below in acknowledgement of my gratitude.
Thursday, October 18, 2007
Bottom-Fishing Fallacies
As housing prices fall, a siren song of hope lures bottom-fishers to bid on foreclosed or distressed properties. Here are three reasons to be cautious.
1. Catching the falling knife is risky. In the stock market, buying a stock which is in a downtrend is called "catching the falling knife." The idea is rather graphic: the only safe way to catch a falling knife is to let it hit the floor and stop quivering. Trying to catch it as it falls (i.e. catching the bottom) usually results in painful financial wounds.
That isn't stopping folks from trying, of course: Big winners, losers at auction of new Manteca homes (San Jose Mercury News)
"Cantrell bought his home a year ago for $670,000, The winning bidder Saturday of an identical home five doors down the street paid $391,000 - 38 percent less than what he paid."
Ouch. But the unspoken question should be: who says a 38% decline is the bottom? There are plenty of people with a strong financial incentive to convince you "this is the bottom": realtors, of course, and underwater lenders hoping to find a sucker:Realtor specializes in selling foreclosed homes. (S.F. Chronicle)
With headlines like this in every bubble state's newspapers, can you really be confident "this is the bottom"? Using what crystal ball? MORTGAGE MELTDOWN: NEIGHBORHOODS CRUMBLE IN WAVE OF FORECLOSURES
LOCAL TROUBLE ZONES: Epidemic repossessions hit several ZIP codes (S.F. Chronicle)
State's housing market agony predicted to deepen next year
Sales and prices will plunge even further after worse-than-expected '07, Realtors say (S.F. Chronicle)
2. That "deal" might be a money pit. Take a look at these typical foreclosed or distressed houses up for sale to get an idea of the expense required to "clean them up for sale or rent:"
Or consider this REO ("real estate owned" by a bank or lender) special, on sale now for only $470,000 in a neighborhood where livable houses are already selling for under $500,000:
Please go to www.oftwominds.com/blog/html to see the photos.
Before you bid on a beauty like this, assuming you can "clean up the pool and yard for a few thousand bucks," I strongly recommend going over the property with a fine-tooth comb with an experienced contractor. A yard of dead weeds can be cleaned up, yes, but it won't be transformed into a lush attractive yard without major expense. Ditto an abandoned pool, etc.
How is the plumbing? Did an angry ex-owner bust a few things on the way out? Or flush a clog down the main line? Even repairing broken fixtures, appliances, screen doors, etc., plus "cosmetic" painting can cost tens of thousands. If you don't believe me, just ask any working remodeling contractor in your neck of the woods.
3. Your low bid just sank the value of the entire neighborhood--including the house you just bought. The bottom-fisher has just played a terribly expensive trick on themselves: they bought a house whose "bargain status" is based on the "old value" of a year ago. But oops, the "new price" is what the bottom-fisher just paid.
In other words, the house that sold for $600,000 last year which was just bought at auction for $450,000 is not worth $600,000 once it's returned to liveable status--it's worth $450,000, and putting $50,000 in repairs into it is going to raise the value to about $455,000. No matter how much money is dumped into the house, it's still only worth the last price paid for a liveable/rentable house in the neighborhood.
Net result: the bottom-fisher just accelerated the knife's fall. Now the "real bargain" house has to priced well under $450,000... until next year, when the "real bargain" will be under $350,000... and so on, until the knife hits the floor and stops quivering--which based on previous declines in housing values (1990-1996) will be about 2012.
Thank you, Eugenie D., ($25.00) for your very generous donation to this humble site. I am greatly honored by your support and readership. All contributors are listed below in acknowledgement of my gratitude.
Wednesday, October 17, 2007
How We Can Have Both Inflation and Deflation
Readers ask: what does the future hold? Inflation or deflation? My answer: both. Take a look at this chart of wheat prices (courtesy of Harun I.) over the past 24 years. Note the prices in blue are nominal (historical) and the prices in red have been adjusted for inflation as per the Bureau of Labor Statistics.
There are lots of charts today--please go to www.oftwominds.com/blog.html to view them all.
While many commentators insist inflation is a monentary phenomenon (too much money chasing too few goods), I humbly submit that the forces of scarcity (supply and demand) act on commodity prices regardless of whether money supply is increasing or decreasing.
This chart of wheat is a good example of supply and demand setting prices, not monentary policy. Each spike represents a shortage, i.e. an imbalance between supply and demand--or perceived supply and demand.
Even as wheat soars in current dollars to $1,000/100 bushels (i.e. $10/bushel), we note that in current dollars, the price spike in 1974 reached $27.41/bushel, and the spike in 1980 hit $13.88. So today's price is by no means a "new high" or even an extreme.
As I noted on the chart, the period of the dot-com stock bubble coincided with low commodity prices, not just in wheat but also in corn, gold and oil, which sank to $10/barrel in 1999.
The force behind the increase in demand for agricultural and petroleum products is the worst-kept secret in the world: the increasing prosperity of the 2.3 billion citizens of China and India. Most observers believe this increase in wealth (and the resultant demand for more and better food and transportation) is unstoppable. If this is true, then we can anticipate looking back on $10/bushel wheat with fond affection for its relative "cheapness."
But monentary policy (heedless expansion of money supply and credit) does of course have consequences in asset pricing, as shown by this graphic history of the Dow Jones Industrial Average:
And here's another manifestation of massive credit expansion, commercial paper (short-term loans):
And last but certainly not least, let's not forget the credit-fueled Mother of All Housing Bubbles:
The list of extremes being fed by monetary expansion (money supplies growing by 18-20% annually in economies growing 3% annually) is endless. Here is a chart of derivatives.
A key observation is that all asset classes have skyrocketed in unison in this debt-based "prosperity." Global real estate markets have climbed to the stratosphere in lockstep with emerging stock markets, collectibles, gold and other commodities.
That correlation makes all asset classes vulnerable to a global downturn. As credit tightens and fear returns to "reprice" loans and risk, then money availability drops and a rapid, across-all-asset-classes deflation will occur.
For example, here is my projection of the whimpering endgame of the housing bubble:
The trillion-dollar question is this: will the coming global deflation in assets reduce demand for food and oil? If so, then even commodities like wheat and oil will plummet in price. If not, then we may experience inflationary prices in commodities (i.e. getting the same item but paying a lot more for the privilege) even as our assets (real estate, stocks, bonds and collectibles) drop in value.
We also have to remember that supply is not necessarily as elastic as demand.
If there is a demand for more houses (a fading memory, to be sure), then we can collectively go out and build more houses. This is not so easy when it comes to finding new super-massive fields of petroleum or growing more wheat; little things like massive crop failures and drought can radically change the supply of corn, wheat and soy beans regardless of demand.
If we recall that the majority of wheat available for export is grown in Canada, Australia and the U.S., we begin to understand the true fragility of global supply. How would a crop failure (a regular occurance in the historical record) in any one breadbasket effect the global price? It's a question worth asking as food inflation in China reach 20% per annum. Food-price fears in China (The Economist)
If we look at the chart of wheat prices above, how can anyone be surprised by the rampant food inflation in China, and indeed, just about everywhere?
Thank you, James Kunstler, ($100.00) for your heart-warming and extremely generous donation to this humble site. I am greatly honored by your support and readership. All contributors are listed below in acknowledgement of my gratitude.
Tuesday, October 16, 2007
How the U.S. Media Failed Homebuyers
News Flash! Barn door open, horses gone! This summarizes the U.S. media's pathetic, craven response to the housing bubble which is engulfing the nation. Here is a graphic depiction of media coverage of the housing bubble as it expanded 2000-2005--back when some forward-looking, skeptical coverage might have done some good:
How much coverage was given to the laughably obvious conclusion that the doubling and tripling of house prices (see below) was unsustainable, guaranteeing an eventual decline that would hand the last batch of buyers substantial losses?
Back on March 1, 2003, the San Francisco Chronicle Home section ran a free-lance article I wrote, All Signs Point To A Top:
Has Bay Area real estate finally reached the dreaded category of a "bubble," soon to follow its scorned dot-com cousin over the tipping point into decline? The prognoses of the pundits of residential real estate are mixed, but the consensus is: Steady as she goes. Sales remain brisk, interest rates are low and will probably stay that way, and there is still unmet demand for homes in the "low-end" range (i.e. those in the bargain basement of less than $400,000).
New home buyers aren't the only ones hoping this turns out to be true; every Bay Area homeowner has a big stake in the seemingly perpetual rise of home prices. You've never seen glee spread quite so fast as the news that a crummy shack down the block just sold for half a million; pardon me as I hug myself, but doesn't that mean we're each another hundred thousand richer for doing nada?
The "no bubble" arguments sound plausible enough -- but I beg to differ. My evidence is not backed by statistics, but nonetheless it has the compelling ring of truth: Every bowwow dog of a house is now for sale, and every one carries an absurd price tag that screams "greed is good."
OK, so I was early. Would-be flippers could have bought just about any house on March 1, 2003, closed by June and flipped it two years later at the top of the bubble in June, 2005 for a big profit. But hindsight is 20/20, and when readers emailed me, asking for advice, I offered only what was common-sense then and remains common-sense now: compare the total costs of buying with renting, and be careful unless you're buying a house you can actually afford for long-term shelter.
My point is simply this: where were the voices of caution and skepticism? Not being published or broadcast much, to be sure. Buying a house is the biggest financial commitment the average American will ever make, and the media has a responsibility to its readers, not just its advertisers--a responsibility it completely abrogated in the inflation of the housing bubble. (Note that as a free-lancer, I pitched the story to my editor--I wasn't assigned the story, nor did the idea come from the newspaper. The coverage, such as it was, came from one underpaid free-lance journalist.)
Though I am not blessed with a Lexis-Nexis subscription to prove this, based on my Web searches it is undeniably true that the mainstream print, Internet and broadcast media provided virtually no front-page or equivalent to a forward-looking, skeptical view of the housing bubble or its predictable consequences during the long run-up.
The first serious coverage provided by any national news outlet was Harpers cover story in May, 2006 on the bubble's long-term consequence: The new road to serfdom: An illustrated guide to the coming real estate collapse. Sadly, the bubble top had already occurred nine months before in August 2005.
Please don't send me links to stories buried on page C-17 or articles which mentioned housing bubble skeptics in passing only to dismiss them; those are simulacrums of journalism, not coverage.
Take a look at this chart, which suddenly appeared everywhere in 2007, eighteen months after the bubble began bursting. How difficult would it have been for financial-press journalists or analysts to have produced this graph on page one back in 2004 or 2005? No harder than it was for them to print it in 2007; the subprime, Alt-A and adjustable mortgages were being sold and recorded back then.
Please go to www.oftwominds.com/blog.html to view all charts.
Ditto for this chart showing the huge run-up of mortgage equity extractions and the predictable decline which will occur as prices fall and equity is exhausted. Yet how many of these charts did you see in the mainstream media in the years 2002-2005 during the final blow-off stages of the housing bubble?
How difficult would it have been for serious publications to look back at the housing declines of the early 90s for some clues about the future of the current bubble? Clearly, the media has been a lapdog of its key advertisers, the housing and lending industries.
If the owners and managers of mainstream media outlets deny this, then the truth is even uglier: they are reactive in their "news," devoid of meaningful analysis and incapable or unwilling to look ahead in a journalistically sound, skeptical fashion.
Now that the bubble's bursting is getting ugly, the media is pleased to run "if it bleeds (losses and human tragedy), it leads." In other words: Terrible news! Barn door open, horses gone! Where were they when the door was being busted down by duplicious lenders, builders and realtors? Where were they when the guardians of the door (the government agencies pledged, funded and mandated to protect the public) all fell asleep and did nothing?
Astute contributor James C. sent in these links to two organizations dedicated to exploring media coverage (or lack thereof):
http://www.fair.org--advertiser%20influence/
Media Reform Information Center Take a look at this chart from the Center's website and tell me this isn't noteworthy:
As James succinctly put it:
"The media have become lapdogs rather that watchdogs. Ownership concentration is the most likely reason. "
Now that the newspapers and broadcast media are filled with tales of housing-bubble woe, maybe we should start asking: where were you in 2003, 2004 and 2005, when you might have helped educate these now-desperate home buyers/speculators on the risks and the high probability of a housing bubble collapse? Where were your barks as watchdogs?
Unfortunately for the nation, the media only wagged its tail as the housing, real estate and lending industries lined their pockets with advertising gold.
If it wasn't for patrick.net and a hearty band of bubble bloggers, the nation would have had no coverage whatsoever of this decade-of-woe-to-come issue.
Thank you, Robert P., ($10.00) for your much-appreciated donation to this humble site. I am greatly honored by your contribution and readership. All contributors are listed below in acknowledgement of my gratitude.
Monday, October 15, 2007
The Yen, the Dollar and the Dow
Many commentators have noted that the yen carry trade (trading firms borrowing in yen at 1% and investing in higher yielding U.S. stocks and bonds) seems to support the U.S. markets. Other analysts have noted that the U.S. market seems to rise when the yen weakens (above 115) and declines when the yen strengthens (is below 115 to the dollar).
Note that when a dollar buys fewer yen (say, 100 yen) the yen has strengthened, while if a dollar buys more yen (say 120 yen) then the yen has weakened relative to the dollar. The Japanese Central Bank famously intervenes to weaken the yen whenever it strengthens too much (apparently the line in the sand is 110 or so) to keep Japanese goods competitively priced to U.S. consumers and to keep Japanese export-corporate profits high.
If a Japanese company only receives 85 yen for a $1 sale in the U.S., then they certainly are earning a lot less of their money than if they receive 120 yen for that same $1 sale. Yen at 85 = strong yen, yen at 120 = weak yen.
So let's look at some charts, courtesy of frequent contributor Harun I. I have formatted them to this site, reducing the detail but enabling us to identify trends.


What can we discern in the three charts?
1. As the dollar weakened March - June, the yen strengthened--just as you'd expect as the dollar dropped.
2. But on June 18, the yen reversed, and weakened even as the dollar continued dropping. In fact, the yen weakened more than the dollar--as if something or someone was desperate not to let the yen rise in value relative to the dollar even as the buck dropped.
3. As the U.S. stock market plummeted to its Aug. 16-17 low, the yen weakened to an extreme and the dollar actually popped up.
4. Since the mid-August stock market low, and the Federal Reserve's half-point drop in the interest rate mid-September, the dollar has plummeted. Yet even as the dollar fell off a cliff, the yen continued to weaken, too. How is that possible? I can only think of one answer: massive manipulation/intervention which sank the yen, countering what should have been a yen-strengthening trend as the dollar weakened.
5. As the dollar dropped, the U.S. stock market soared.
6. Around October 1, the yen finally succumbed to the declining dollar and reversed course, turning from a weakening trend to a strengthening trend. To date, this change has had no discernable effect on the U.S. stock market or the dollar, which halted its precipitous decline for a brief period of time.
7. Does this yen reversal portend a change in the dollar or the U.S. stock market? As the dollar has dropped, the yen should have continued to strengthen. Instead, it rapidly weakened from mid-June to October 1. Isn't that a bit odd?
The weak yen makes for a profitable carry trade. Here's why: if you borrow in yen at 120/dollar and buy U.S. stocks and bonds, and then sell and take your profits, you have to sell your dollars and buy back the yen to pay back your loan. If you borrowed yen at at 120/dollar and bought the yen back at 100/dollar, what happened? You lost 20% of your money in the currency exchange. A stronger yen is a catastrophe for the carry trade.
Since currency trading is often highly leveraged, this swapping of dollars for yen and vice versa is especially fraught with risk.
So what can we conclude? I am only a pawn in the big game of life, but it sure looks like someone intervened on a massive scale to weaken the yen since mid-June, when the U.S. stock market began to falter. This became more and more difficult to sustain as the dollar slid down a steep slope, and the U.S. stock market reflected this increased risk in the carry trade by becoming volatile.
Since October 1, the U.S. stock market has continued rising even as the yen strengthened and the dollar clung to record lows. As the yen strengthens, the carry trade becomes more precarious and its ability to support the U.S. stock market recedes.
To date, this strengthening trend in the yen has had no visible effect on the U.S. market. But how long can it continue before it does have a negative effect? If the dollar resumes its slide, and the yen continues strengthening, the carry trade support of the U.S. market vanishes.
Will that be enough to cause the U.S. market to reverse into a steep decline? Maybe not, but it certainly would knock a key prop out from under it.
Thank you, Kent M., ($25.00) for your much-appreciated generous donation to this humble site. I am greatly honored by your contribution and readership. All contributors are listed below in acknowledgement of my gratitude.
Saturday, October 13, 2007
Readers Journal has been updated! Check out a wonderful array of opinion and commentary, including two new essays, NASA and the Warmest Year (Michael Goodfellow) and Another First For England (Protagoras) and another poem by Protagoras Wherever you are . "The Warmest Year" is a must-read on global warming data.
Readers' Picks: Books and Movies Extravaganza
NOTE: please go to www.oftwominds.com/blog.html to activate all book and film links.
Knowledgeable readers added to our trove of book and film recommendations. John U. submitted a selection of classic World War II books and films, Don E. sent in a list of some of his favorite films and Johnn K. added a recent biography of Samuel Adams.
As I have mentioned before, I link the books and films to amazon.com mostly for the reviews posted there by other readers/viewers, which are almost always interesting and helpful. If you purchase any book or film on amazon.com from this site, I receive a small commission-- you pay no more than if you went to amazon.com from a blank browser window. If you borrow or rent a book or film, the reviews posted on amazon will probably assist your selections.
John U.
The Forgotten Soldier by Guy Sajer is an impressive read. After reading it, it makes our military's sacrifices on the ground seem like not much, compared to the hell of the eastern front, and what the Russians endured. Guy was an Alsatian that signed up for the Wehrmacht and spent 3 years, and somehow survived.
The Long Walk: The True Story of a Trek to Freedom by Slavomir Rawicz is an account of a 4,000 mile walk from the gulags of Siberia to India, by a Polish army officer.
Soldier of Orange is one the most impressive WW2 films I know. Set in Holland, it seems 100% real, compared to most WW2 films that leave a lot to be desired.
Mud Beneath My Boots: A Poignant Memoir of the Effects of War on a Young New Zealander by Allan Marriott is a newer WW 1 book, about a New Zealander that spent nearly the entire war in the trenches, poignant and seldom have the horrors of WW1 been so well documented by one man. p.s.: We now have been in Iraq, longer than World War 1 lasted... yikes.
Don E.
Just saw a very good war film i'd never heard of: USSR film, Come and See . it is an essentially plotless film that follows a youth off to join the resistance in Byeloruss. one thing that struck me in its rather surreal moments was that Coppola obviously had seen this before making Apocalypse Now - a favorite of mine.
A good antidote is another USSR film we just saw: Railway Station for Two.
best WWII film made on the U.S. side is A Walk in the Sun. this movie captivated me as a kid and I must have seen it 15 or 20 times in great prepubescent fervor.
More mainstream than the others on the list, but really moves me. Not that it really has squat to do with the quality of the film, but this is the most perfect theme-song movie; theme songs usually get in the way, or are just inappropriate. This movie would not exist in my mind in such clarity if i didn't hear that voice in the background when i thought of it. A Walk in the Sun-IMDB
(NOTE: IMDB is the Internet Movie Database website--CHS)
Sure, Chinatown, The Searchers, Blade Runner, and Out of the Past are great films that deserve to live forever, and I will and do watch them over and over. But what about equally great films that don't make the lists? Now that is interesting; the men are about to be separated from the goats. (most women will say you can't do it...) I won't give my pets numerical ratings as my choice of what's best shifts with time of day, what I have eaten, impending flatulence and how long it has been since I cringed back in horror from seeing My President on the glassy screen.
Coup de Torchon - Criterion Collection Absolutely one of the best films ever! I watch this repeatedly and am stunned. Noiret and Huppert have never been better. Finally, Jim Thompson comes to the screen in riveting style. Coup de Torchon-IMDB
Valdez is Coming Burt Lancaster carries this film with absolute dignity. I understand he was contracted to make several westerns and did so unwillingly, but he was perfect here. Its is the best thing done from an Elmore Leonard story. Sometimes a movie like this lets the supporting cast really stand out. Valdez Is Coming-IMDB
The Hairdresser's Husband Another French film. haven't seen it in a long time, but it sticks in my mind. as to my choices, they are not usually blessed with happy endings, and then tend to be a bit dark and bent. is that you cup of tea? The Hairdresser's Husband-IMDB
The Wind and the Lion Ok, this one is getting even closer to mainstream, but it is one I just keep watching. Maybe it falls under the heading of 'a guilty pleasure' - I don't give a damn. A very fine movie. When Sean Connery says "we will all eat lamb in paradise" with that glint, I get a tiny shiver that must be the first step a what a young man feels when moving toward jihad. The Wind and the Lion-IMDB
Robin and Marian Sticking with major stars here, but in a film that nobody seemed to notice. A great cast all at the top of their form. It is the quintessential autumnal film. Robin and Marian-IMDB Two other autumnal - i like that word - films i will toss in here: The Wild Bunch and the Lee Marvin version of Monte Walsh. Winding-down and taking stock movies grab me.
On the noir/crime side i will toss out three titles:
Charley Varrick Charley Varrick-IMDB
Ride the Pink Horse-IMDB Another noir novelist done right: Dorothy Hughes - how many women wrote good noir in the '40s?
Hammett Possibly another guilty pleasure. Hammett-IMDB
Also in the noir camp is the original Italian version - unauthorized - of The Postman Always Rings twice: Ossessione Compare this one to the 2 American made films. Ossessione-IMDB
Johnn K.
Just finished a great book, Samuel Adams: Father of the American Revolution by Mark Puls. Without him the revolution probably wouldn't have happened. Through his zeal, his will and his articulate writing, people woke up to tyranny.
Sadly, there's no Sam Adams today and even if there were, the general population is too hypnotized by being 'entertained'.
I am one of the rare people, getting rarer each day, that reads an occassional book. You're one of those people as well. But I fear the book business has gone the way of buggy whips.
Thank you, John, Don and Johnn, for the excellent recommendations.
As described above (and elsewhere on the site), I earn a small commission on any book, DVD or other item purchased from amazon.com via this site. Although the identity of the buyer is of course unknown to me, amazon.com does have to track the titles purchased by readers of this site. Judging by the list of books purchased here over the past few months, my readers are a lot smarter than I am (no surprise there).
Since some of you might find the books purchased by other readers to be of interest--I certainly did, having never heard of Biker Billy's Cookbooks, or these titles on war and finance/trading--I reprint it here for your enjoyment. I have not listed titles purchased by readers which I have recommended elsewhere, such as my "Essential Books" list in the lower right sidebar or the Recommended Books/Films .
Arms and Influence by Thomas C. Schelling
Biker Billy Cooks with Fire: Robust Recipes from America's Most Outrageous Television Chef by Bill Hufnagel
Boiling Point: How Politicians, Big Oil and Coal, Journalists and Activists Are Fueling the Climate Crisis--And What We Can Do to Avert Disaster by Ross Gelbspan
Contemporary Nuclear Debates: Missile Defenses, Arms Control, and Arms Races in the Twenty-First Century by Alexander T. J. Lennon
Crash Proof: How to Profit From the Coming Economic Collapse by Peter D. Schiff
Defense Strategy for the Post-Saddam Era by Michael E. O'Hanlon
Desert Solitaire: A Season In the Wilderness by Edward Abbey
End of the Line: The Rise and Coming Fall of the Global Corporation by Barry C. Lynn
Finding The Target: The Transformation of American Military Policy by Frederick Kagan
Getting Things Done: The Art of Stress-Free Productivity by David Allen
Hard Call: Great Decisions and the Extraordinary People Who Made Them by John McCain
How to Profit from the Coming Real Estate Bust: Money-Making Strategies for the End of the Housing Bubble by John Rubino
Hypnotic Writing: How to Seduce and Persuade Customers with Only Your Words by Joe Vitale
Identity and Violence: The Illusion of Destiny by Amartya Sen
Legacy of Leadership: Lessons from Admiral Lord Nelson by Joseph F. Callo
Life of Johnson by James Boswell
Man, the State, and War by Kenneth N. Waltz
Mobs, Messiahs, and Markets: Surviving the Public Spectacle in Finance and Politics by William Bonner
Nemesis: The Last Days of the American Republic by Chalmers Johnson
On the Origins of War: And the Preservation of Peace by Donald Kagan
Simpleology: The Simple Science of Getting What You Want by Mark Joyner
The 2010 Meltdown: Solving the Impending Jobs Crisis by Edward E. Gordon
The Age of Lincoln by Vernon Orville Burton
The Dip: A Little Book That Teaches You When to Quit (and When to Stick) by Seth Godin
The Fallacies of Cold War Deterrence and a New Direction by Keith B. Payne
The Greatest Story Ever Sold: The Decline and Fall of Truth from 9/11 to Katrina by Frank Rich
Way of the Turtle: The Secret Methods that Turned Ordinary People into Legendary Traders by Curtis Faith
Your Life As Art by Robert Fritz
The End Is Not Nigh by Charles Gave
MI6: Inside the Covert World of Her Majesty's Secret Intelligence Service by Stephen Dorril
A Preponderance of Power: National Security, the Truman Administration, and the Cold War by Melvyn Leffler
And please scan Reader's Choice: World War II books, World War II Books, Torture, Insight: or, In a New Light and Hooray for the Small Press--and the Web if you missed any of the week's other recommendations.
Thank you, Tom S., ($50.00) for your very generous donation to this humble site and also for encouragement. I am greatly honored by your contribution and readership. All contributors are listed below in acknowledgement of my gratitude.